Local models · Quantization · Qwen 3.8 27B
The Quantization Tax Nobody Charged: Qwen 3.8's Q4 Quant Matches Its Published Scores on a Single 5090
Qwen 3.8 27B is the release the local-model community spent months refreshing feeds for. It landed on my rig on August 15th, and after more benchmark runs than any post on this blog — 13 GPU-hours on Qwen’s own published conditions alone — the cheapest sensible quantization reproduced the numbers Qwen published for the unquantized model. This post is about that result, the three quants that tied, and a token-budget bug that will bite anyone benchmarking a thinking model.
The one everyone was waiting for
Qwen 3.8 had the longest hype runway of any open-weights release this year, and for once the wait was justified. The 27B that arrived is not the dense transformer its parameter count suggests: only 16 of its 64 layers keep a conventional KV cache, while the other 48 run Gated Delta Net — a fixed-size recurrent state that doesn’t grow with context at all. That design makes a 262,144-token window cost 8.7 GB of cache instead of the ~35 GB a dense model of this shape would need. The whole model, at full context, fits on one 32 GB RTX 5090 with room for four parallel slots.
The question I wanted answered was the one every local deployment starts with: which quantization should I run? Q4 is the default everyone downloads; Q6 is the upgrade everyone wonders about; NVFP4 is the new Blackwell-native option with real tensor-core support. So I put all three through the same gauntlet, with a Q8 reference for the sensitive measurements.
The verdict: run the Q4
Four instruments, one answer.
Qwen’s own benchmarks, at Qwen’s own settings. Under the published conditions — thinking mode on, temperature 1.0 — the Q4 quant scored 89.4% on GPQA Diamond against Qwen’s published 89.2, and 78.0% on IFBench against their 79.5. Both gaps are smaller than their error bars. The right word is indistinguishable — not “matched”, and definitely not “beat”. A 4-bit quant appearing to outscore its unquantized parent is a protocol smell, not a triumph.
A distribution-level microscope. KL-divergence against a Q8 reference over 51K tokens of real source code shows Q6 is measurably 5× closer to Q8 than Q4 is — the difference is real and cleanly detectable. Then the task benchmarks show it converts into nothing: on my 95-CVE security benchmark, Q4 scored 49/95, Q6 48/95, NVFP4 48/95, and the paired statistical test on the disagreements reads p = 1.0 — an exact dead heat. A microscope sees the difference; no task I ran can.
Long context, the part that wasn’t safe to assume. A model running 48 of 64 layers through fixed-size recurrent state has a much less obvious right to a 262K window than a dense transformer. RULER says the window is real: every synthetic retrieval task, perfect, at every length up to 262,144 — at Q4.
And the deployment table breaks the tie. Q6’s extra weights plus the per-sequence recurrent state mean it tops out at 196K with speculative decode, collapsing to 98K at eight slots. Q4 holds the full 262K at up to four slots. If you want the window this model was built for, Q4 isn’t the compromise — it’s the only quant that delivers it.
The result worth stealing
The best story in the project is a number that was wrong. My first GPQA run, with a 16,384-token output budget, scored 72.0%. That number is fiction: 26% of questions ran out of budget mid-reasoning and were scored as wrong answers, invisibly — a truncated thinking-mode generation comes back with empty content and looks exactly like a confident miss. Re-run with a 65,536-token budget, the score is 89.4%.
Worse, the damage isn’t noise, it’s bias: median reasoning length varies 22× by subject, so a mid-range cap doesn’t degrade the score evenly — it quietly deletes organic chemistry, the longest-reasoning domain, and only that. If you benchmark thinking models: record finish_reason, count truncations separately from errors, and report both bounds. The full story, with the receipts, is in the deep dive.
What to take away
- Qwen 3.8 27B lives up to the wait — top of my CVE benchmark, published-score parity at Q4, and a genuinely usable 262K window on a single consumer GPU.
- Run the Q4 (UD-Q4_K_XL). Q6 is measurably closer to the reference distribution and it buys you nothing a task can detect, while costing a quarter to a half of your context window.
- “NVFP4” reads as 4-bit and prices like 6-bit. Only some layers are FP4; it’s Q6-sized on disk, prefills 2.1× faster than llama.cpp, and decodes 4.5–6× slower on a 32 GB card. Bulk document scanning, maybe. Anything that writes, no.
- Give thinking-mode evals a 65,536-token budget and audit truncations, or your benchmark measures your cap instead of the model.
- The negative results are the point. RULER saturated, EvalPlus near-saturated, three quants tied — that’s what makes the Q4 recommendation credible rather than convenient.
In this deep dive — it’s a long one; every section stands alone:
- The question this post answers
- The model is not what the parameter count suggests
- Rig, config, and two traps checked rather than assumed
- How fast it reads, how fast it writes
- HoF-Bench: top of a tight pack
- RULER: is the 262K window real?
- EvalPlus: the quant is not broken
- The benchmarks on Qwen’s own card
- GPQA Diamond and IFBench, under Qwen’s own conditions
- What a bigger quant buys you
- NVFP4: reads like 4-bit, prices like 6-bit
- The verdict, assembled
- What I’d trust and what I wouldn’t
The question this post answers
The previous post benchmarked seven local models on HoF-Bench v1 — 95 real, disclosed CVEs across eight codebases, where the model gets the pre-fix source files and has to name the most serious vulnerability. Muse Glimmer 30B took the top slot at 50.0%, with an asterisk about its context ceiling.
Qwen3.8-27B-UD-Q4_K_XL.gguf landed on the rig on 2026-08-15, after a wait the local-inference community had turned into a running joke. This post runs it through everything: HoF-Bench in three quantizations, RULER at four context lengths, EvalPlus, an MTP-drafter shootout, a Q8-referenced KL-divergence comparison, NVFP4 on a second runtime, and finally GPQA Diamond and IFBench under Qwen’s published conditions. Roughly 13 GPU-hours went into that last pair alone.
Every section feeds one question — which quant should you deploy? — and the answer only became trustworthy because four independent lines of evidence converged on it. Every number here was measured on this rig; nothing is written from expectation.
The model is not what the parameter count suggests
general.architecture reads qwen35 — the same arch id llama.cpp uses for the Tess-4 27B fine-tune already on this rig. The config underneath is a different animal:
| value | |
|---|---|
| params | 27.32B, dense (n_expert = 0) |
| layers | 64, plus one NextN layer (blk.64) |
| full-attention layers | 16 of 64 |
| other 48 layers | Gated Delta Net (fixed-size recurrent state) |
| n_head / n_head_kv | 24 / 4 |
| head dim (k, v) | 256 / 256 |
| n_ctx_train | 262,144 |
| rope | mrope, sections [11, 11, 10, 0], freq_base 1e7 |
| weights (UD-Q4_K_XL) | 16,401 MiB on GPU |
Three things follow from that table, and each one matters later.
Only a quarter of the layers keep a KV cache. The other 48 carry a fixed-size recurrent state that does not grow with context at all — the same shape of trick Nemotron 3 Nano pulls with its Mamba2 layers. It makes 262K context far cheaper than the parameter count implies:
| component (262,144 ctx, 1 slot, K+V q8_0) | VRAM |
|---|---|
| weights | 16,401 MiB |
| KV cache (16 attention layers, q8_0) | 8,704 MiB |
| GDN recurrent state (48 layers) | 748 MiB |
| compute buffers | 1,360 MiB |
| MTP draft KV cache (1 layer, f16) | 1,024 MiB |
| MTP draft compute | 324 MiB |
| total | 29,154 MiB / 32,607 MiB |
That works out to 34 KiB per token of KV cache. A dense 64-layer model with the same head geometry would want ~136 KiB per token — roughly 35 GB for the same window. It would not fit on this card at all.
MTP is baked into the GGUF. nextn_predict_layers = 1, with the drafter’s weights in blk.64.nextn.* — so --spec-type draft-mtp needs no separate draft file. If you don’t pass the flag, llama.cpp just logs unused tensor blk.64.nextn.* -- ignoring at load and you lose speculative decode without ever being told you had it. Note also that the draft context allocates its own KV cache, in f16, which --cache-type-k/v does not govern: a flat 1,024 MiB at full context no matter how you quantize the main cache.
The advertised window is 262,144, and this time it’s a hard ceiling that matches the metadata. Unlike Muse Glimmer — where the finding was that the real ceiling was half the advertised one — n_ctx_train here backs the claim. Whether the model can use all of it is a separate question, and the one this post spends most of its time on, because a model that runs 48 of its 64 layers through fixed-size recurrent state has a much less obvious right to a 262K window than a dense transformer does.
Rig, config, and two traps checked rather than assumed
Same rig as the previous post: RTX 5090 32 GB, llama.cpp build-cuda, served through llama-swap. Three profiles — qwen38-4-slots, qwen38-2-slots, qwen38-singleshot — mirroring the existing Qwen 3.6 shapes. Measured at full 262,144 context with K+V q8_0:
| profile | VRAM | headroom |
|---|---|---|
qwen38-singleshot (parallel 1) |
29,154 MiB | 3.4 GB |
qwen38-4-slots (parallel 4) |
31,014 MiB | 1.6 GB |
The KV cache is unified (kv_unified = true), so the 8,704 MiB KV total does not grow with slot count — only the per-sequence GDN recurrent state does, at roughly 150–190 MiB per sequence. Hold that thought; it decides the whole Q6 story later.
Two failure modes were verified rather than assumed away, because both fail without an error message:
The flash-attn pairing trap. A previous investigation found that stock llama.cpp only compiles CUDA flash-attn kernels for matched KV quant pairs — a mismatched cache once dropped prefill attention onto the CPU at 30–75 tok/s with no error anywhere. q8_0/q8_0 is a matched pair so it should be fine here, but “should be” is how that bug survived for weeks the first time. Verified directly: the largest HoF-Bench task (153,046 prompt tokens) prefilled in 100.9s at 1,517 tok/s with GPU utilization sampling 76–99% throughout. That’s GPU prefill.
The GDN kernel version of the same failure. At load, llama.cpp prints whether it resolved fused Gated Delta Net kernels:
resolve_fused_ops: fused Gated Delta Net (autoregressive) enabled
resolve_fused_ops: fused Gated Delta Net (chunked) enabled
Both must say enabled. On a CPU-only load they read not supported, set to disabled — and since 48 of 64 layers are GDN, an unnoticed fallback there would be far more expensive than the flash-attn one was. Re-read those two lines after any llama.cpp rebuild.
How fast it reads, how fast it writes
Two rates matter and they move in opposite directions, so this post reports both everywhere rather than collapsing them into one tok/s figure: prefill (how fast the model reads its prompt — batched, compute-bound, untouched by speculative decode) and decode (how fast it writes — sequential, bandwidth-bound, the only thing speculative decode can accelerate).
Measured on UD-Q4_K_XL, 1 slot, K+V q8_0, 300 generated tokens per measurement. All rates are tokens per second, higher is better.
MTP on vs off (262,144 ctx)
| short ctx (12 tok) | ~100K ctx (100,353 tok) | |
|---|---|---|
| decode (write), MTP off | 74.4 | 54.2 |
| decode (write), MTP on | 114.9 | 74.3 |
| MTP decode gain | +54% | +37% |
| prefill (read), MTP off | — | 2,106 |
| prefill (read), MTP on | — | 1,949 (−7.5%) |
| draft acceptance | 0.44 (mean len 2.76) | 0.43 (mean len 2.72) |
Short-context prefill is blank deliberately: at 12 prompt tokens the measurement is dominated by per-request overhead and says nothing about the model. Two smaller observations: decode degrades ~27% from short context to 100K — that’s the cost of the 16 full-attention layers, while the 48 GDN layers contribute a fixed cost that doesn’t grow; a fully dense model would fall off considerably harder. And draft acceptance held at ~0.43 at both depths, which is mildly surprising — it did not degrade over the range tested.
Every drafter llama.cpp can run, compared (131,072 ctx)
llama.cpp exposes several speculative-decode backends. DFlash is excluded for a boring reason: no DFlash drafter exists for Qwen 3.8 yet. A drafter is trained against one specific target and needs its vocabulary (248,320 here), so a Qwen 3.6 drafter is not a drop-in. This sweep runs at 131,072 rather than full context because DSpark loads a standalone drafter plus its own KV and compute buffers, and at 262,144 it would have OOM’d before measuring anything. (Halving the allocation turned out to cost under 1.5% on every rate, so the tables are comparable — allocating the full window is free in speed and only costs VRAM.)
“Wall” is total seconds for one 100K-prompt / 300-token request — the only column where lower is better. Percentages are against the no-drafter baseline.
| config | prefill @100K | decode short | decode @100K | wall @100K (s) | VRAM (MiB) | acceptance |
|---|---|---|---|---|---|---|
| no spec decode | 2,080 | 74.0 | 54.0 | 54.0 | 21,934 | n/a |
| MTP (n-max 4) | 1,938 (−6.9%) | 119.5 (+61%) | 75.6 (+40%) | 56.0 | 23,522 | 0.43–0.47 (len 2.7–2.9) |
| DSpark BF16 | 1,703 (−18%) | 83.0 (+12%) | 55.9 (+3.5%) | 64.5 | 28,046 | 0.30–0.31 (len 1.9) |
| DSpark Q8_0 | 1,697 (−18%) | 87.9 (+19%) | 58.7 (+8.7%) | 64.4 | 26,830 | 0.31 (len 1.9) |
Reading the baseline row: ~48s reading the 100,353-token prompt, then ~6s writing 300 tokens. Prefill is ~28× faster per token than decode because the prompt is processed in parallel batches while generation is strictly sequential. That asymmetry is why speculative decode, which only touches the sequential half, cannot rescue a read-heavy workload no matter how good the drafter is.
MTP wins on every axis, and it is not close — roughly five times DSpark’s decode gain, a third of its prefill penalty, 3.3–4.5 GB less VRAM, and far better acceptance (0.44 at mean length 2.8 against 0.31 at 1.9 — a drafter whose proposals survive verification less than a third of the time spends most of its compute on tokens that get thrown away). Both DSpark arms are slower end-to-end than running no drafter at all — 64.4–64.5s against 54.0s, a 19% regression — which reproduces the warning in the conversion author’s own README. DSpark also cannot run the 256K profile at all: +4.9 to +6.1 GB over baseline, against 3.4 GB of headroom. Verdict: MTP stays, DSpark is out, DFlash is unavailable. No config change follows — the useful kind of negative result, since the alternative was believing an untested option might be faster.
The MTP break-even rule
Speculative decode delivers +37–54% on decode here, yet it moved HoF-Bench’s total wall clock by only 6%. Those two numbers look contradictory until you set MTP’s −7.5% prefill cost against its decode gain: MTP is a net win only when completion tokens exceed roughly 1/140th of prompt tokens. HoF-Bench’s median task sits at a 1/51 ratio (helps), its largest at 1/1000 (hurts), and the 6% net is many small tasks winning slightly more than a handful of enormous ones lose.
The drafter sweep validated the rule on a workload it wasn’t derived from: 300 tokens against a 100K prompt is 1/334 — well under break-even — and the MTP request finished in 56.0s against the baseline’s 54.0s. Decoding 40% faster, finishing slower. That’s the prefill penalty winning exactly where the arithmetic says it should.
The practical rule: work out your own completion-to-prompt ratio. Above ~1/140, turn MTP on. Below it — bulk scanning, single-verdict classification over huge bundles — MTP is a net loss that also costs 1,024 MiB of draft KV cache to have. This is why the RULER run below has MTP off: at 30–128 generated tokens against prompts up to 262,144, enabling it would have added ~28 minutes.
HoF-Bench: top of a tight pack
Same harness, corpus, prompt and grader as the previous post: 95 real CVEs, temperature 0, fixed seed, max_tokens 600, deterministic local grading — file-match (right file named?), family-match (right coarse vulnerability family?), strict-match (both). As before, this is my lightweight proxy grader, not HoF-Bench’s official blinded judge; it will pass some half-right answers the real methodology would catch.
A correction to the previous post
The previous post stated that all seven models ran without speculative decode. That was wrong for two of the seven — the archived and current configs both show the Qwen 3.6 and Gemma-4-31B singleshot profiles carrying --spec-type draft-mtp. It matters because speculative decode demonstrably changes outputs at temperature 0 (data below), so that table mixed two protocols unannounced. Since Qwen 3.8’s MTP is baked into its GGUF, the natural configuration is MTP-on — so this run was done both ways, and both numbers are reported.
Results
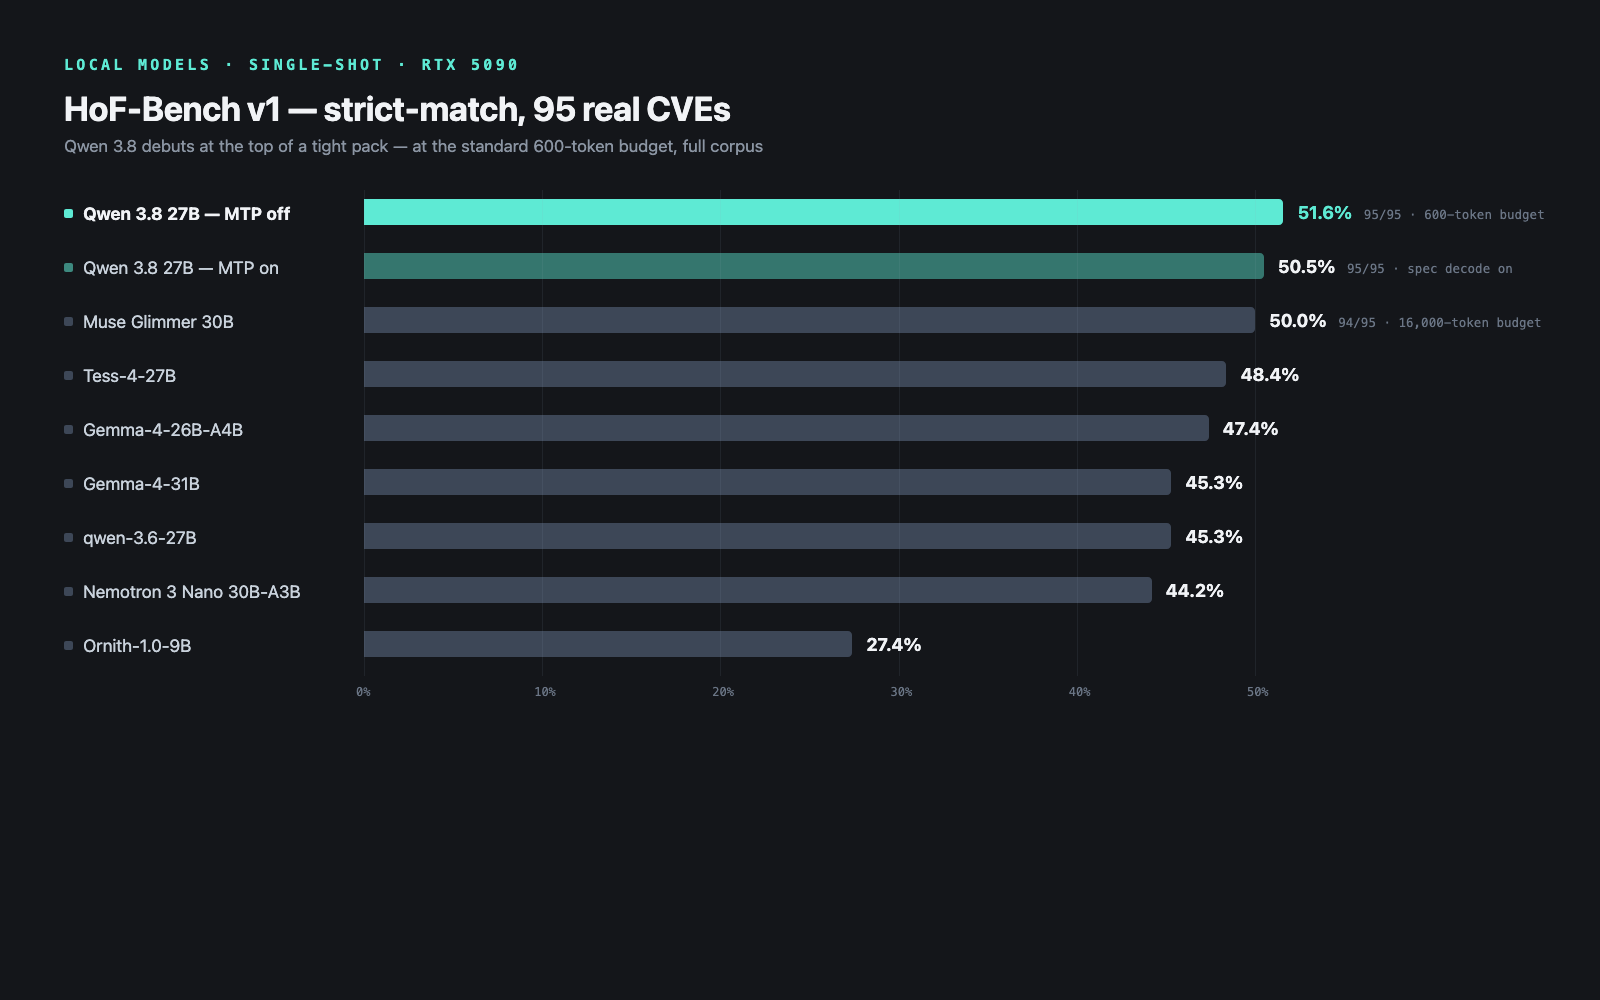
Both arms completed 95/95, zero failures, zero empty responses.
| model | scored | file% | family% | strict% |
|---|---|---|---|---|
| qwen38 (MTP off) | 95/95 | 100.0 | 51.6 | 51.6 |
| qwen38 (MTP on) | 95/95 | 100.0 | 50.5 | 50.5 |
| muse-glimmer | 94/95 | 100.0 | 50.0 | 50.0 |
| tess4 | 95/95 | 100.0 | 48.4 | 48.4 |
| gemma26a4b | 95/95 | 100.0 | 47.4 | 47.4 |
| nemotron | 95/95 | 95.8 | 47.4 | 44.2 |
| gemma-31b | 95/95 | 100.0 | 45.3 | 45.3 |
| qwen-3.6 | 95/95 | 100.0 | 45.3 | 45.3 |
| ornith-9b | 95/95 | 100.0 | 27.4 | 27.4 |
Qwen 3.8 takes the top slot at 51.6% — and unlike Muse Glimmer, it does so at the standard 600-token budget over the full 95-task corpus. Against Qwen 3.6, the model it directly succeeds, that’s +6.3 points. The margin over the pack is not large: one task is 1.05 points, so the gap to Muse Glimmer is a task and a half. Read this as “at the front of a tight pack”, not a decisive win. The file% column repeats the previous post’s pattern — localization is saturated, and every point lost was lost on naming the vulnerability, not finding the file.
What speculative decode did to the outputs
Running the same corpus twice — with and without MTP, temperature 0, fixed seed — gives a much larger sample of a divergence the previous post noticed once:
| byte-identical responses | 40 / 95 (42.1%) |
identical VULN: verdict line |
88 / 95 (92.6%) |
| same file reported | 95 / 95 (100%) |
| strict score | 50.5% (on) vs 51.6% (off) |
| wall clock | 13.7 min (on) vs 14.6 min (off) |
Speculative decode changed 58% of responses at the byte level while leaving the verdict intact 92.6% of the time and the file 100% of the time. In theory, correct speculative decoding reproduces the target model’s exact greedy output; it demonstrably does not here, and whether that’s batched-verification floating-point noise or a bug in the draft-mtp path stays unresolved. The 1.1-point score difference is one flipped task — noise, not a finding. And the wall-clock line is the break-even rule in action: MTP bought 6% on this prefill-dominated corpus, not the 40–90% it delivers on generation-heavy work.
RULER: is the 262K window real?
The headline question for this architecture: does a model running 48 of 64 layers through fixed-size recurrent state genuinely retain information across 262K tokens, or is the advertised window nominal?
Results
| task | 4096 | 32768 | 131072 | 262144 |
|---|---|---|---|---|
| niah_single_1 | 100.0 | 100.0 | 100.0 | 100.0 |
| niah_single_2 | 100.0 | 100.0 | 100.0 | 100.0 |
| niah_single_3 | 100.0 | 100.0 | 100.0 | 100.0 |
| niah_multikey_1 | 100.0 | 100.0 | 100.0 | 100.0 |
| niah_multikey_2 | 100.0 | 100.0 | 100.0 | 100.0 |
| niah_multikey_3 | 100.0 | 100.0 | 100.0 | 100.0 |
| niah_multivalue | 100.0 | 100.0 | 100.0 | 100.0 |
| niah_multiquery | 100.0 | 100.0 | 100.0 | 100.0 |
| vt | 100.0 | 100.0 | 100.0 | 100.0 |
| cwe | 100.0 | 100.0 | 100.0 | 100.0 |
| fwe | 100.0 | 100.0 | 100.0 | 100.0 |
| synthetic avg (11) | 100.0 | 100.0 | 100.0 | 100.0 |
| qa_1 | 60.0 | 80.0 | 66.7 | 100.0 |
| qa_2 | 90.0 | 80.0 | 66.7 | 50.0 |
Zero empty responses at any length. Every synthetic task is perfect at every length, including 262,144. No degradation curve, because there is nothing to degrade — the window is real, not nominal. For a mostly-recurrent model, that was the result that most needed checking and was least safe to assume.
The honest caveat: this saturates the benchmark, which limits what it can tell you. A perfect score is a floor on capability, not a measurement of it — RULER cannot distinguish this model from one twice as good, and it cannot rank Q4 against Q6 either. At 262,144 the synthetic result is 22/22 (11 tasks × 2 samples), which by the Clopper–Pearson interval puts the true pass rate above ~85% with 95% confidence — strong, but not the “>99%” a literal 100.0 suggests. More samples would tighten the bound; they wouldn’t produce a more interesting number, since the model would have to start failing for the benchmark to become informative.
Why QA is reported separately
The two QA rows bouncing around (60 → 80 → 66.7 → 100 on qa_1, the opposite direction on qa_2) is not a retention signal. RULER grades QA with a bare case-insensitive substring test — no punctuation or paraphrase normalization. Sampling qa_1’s misses at 4096: “Denmark, Iceland, and Norway” scored wrong against reference “Denmark, Iceland and Norway” (an Oxford comma); “Duke William II of Normandy” scored wrong against “William the Conqueror” (the same person). One of the three sampled misses was a real error. The QA tasks measure lexical overlap with SQuAD/HotpotQA reference strings; the eleven synthetic tasks generate their own unambiguous answers and have no such problem. Folding them together would understate exactly the capability the benchmark exists to measure.
Run shape and its limits
RULER’s stock shape is 13 tasks × 500 samples × 4 lengths, which is not remotely affordable here — a single 262,144-token sample costs 236.9s of prefill (measured, not estimated); the full grid would be months. The run used 10 samples per task at the two control lengths (4096, 32768), 3 at 131,072, and 2 at 262,144. At 2–3 samples a single miss moves a task by 33–50 points, so read the per-length aggregate and treat per-task columns at the long lengths as indicative. Two setup notes: the tasks are generated by NVIDIA’s official RULER code, not a reimplementation, and I added a llamacpp tokenizer type that calls the running server’s own /tokenize — length targeting only means something if the token counts are the model’s own (verified exact round-trip).
Four quiet failures fixed to run it at all
None of these are Qwen’s fault; they’re harness problems, and all four fail without an error, which is why they’re written down here. (1) RULER’s prepare.py never checks its subprocess exit code — a completely failed task reports as a success, which masked the next two. (2) It shells out to python, which doesn’t exist on a python3-only system — and per (1), it looked like it worked. A PATH shim fixes it; note a bare symlink out of the venv does not, because Python resolves pyvenv.cfg against the resolved executable and quietly drops you back to the system interpreter. (3) english_words.json ships as a Git LFS pointer — clone without git-lfs and the cwe task dies parsing a 132-byte stub, silently, per (1); without noticing, the “13-task” aggregate would have been computed over 12. Fetched the real 8.2 MB file from the LFS endpoint and verified its SHA256 against the pointer’s oid. (4) qa.py has an unbounded retry loop that spins at 100% CPU whenever a QA example’s own gold documents exceed the token budget — never triggers for squad, reliably for hotpotqa. Patched to skip to the next example; upstream’s behaviour is to hang forever.
EvalPlus: the quant is not broken
EvalPlus runs HumanEval and MBPP, then re-runs both against a much larger generated test suite — the + columns. The gap between columns is the point: it measures how much of the base score was solutions passing thin test suites by luck. Greedy pass@1, temperature 0, MTP off.
| dataset | problems | base tests | + extra tests | drop |
|---|---|---|---|---|
| HumanEval | 164 | 95.1 | 92.1 | −3.0 |
| MBPP | 378 | 91.0 | 77.5 | −13.5 |
Report the + columns; the base scores are inflated for exactly the reason EvalPlus exists. The MBPP drop means more than one in eight “passing” MBPP solutions were passing by luck — normal across models, MBPP’s stock tests are famously thin, but it’s the honest read of what a base MBPP score is worth.
What this establishes: the Q4 quant is not damaged in the way bad quantization shows up first — broken syntax, incoherent code, lost instruction-following. It scores where a healthy 27B should. What it does not establish: anything at the top end (HumanEval at 95.1 base is old enough to be in everyone’s training data and close to saturated), and it cannot resolve Q4 against Q6 — at 164 and 378 problems the standard error is ~2.1 points, and a quant effect would be a fraction of one. That’s what the KL section is for.
One run note bears repeating: evalplus.evaluate executes model-generated Python on the host. Its reliability_guard disables destructive builtins, but that is not a sandbox — containerize it if you don’t trust the generating model. And MTP stayed off despite this being the one benchmark where it would have paid (short prompts, long completions), because speculative decode was shown above to change 58% of outputs, and a published accuracy number should be reproducible.
The benchmarks on Qwen’s own card
Before running more benchmarks, one question comes first: can any of these numbers be compared against what the model’s authors publish? Almost entirely no. Qwen’s card for this model reports Terminal Bench 2.1 (73.0), SWE-bench Pro (61.7), LiveCodeBench v6 (90.3), a slate of agent and vision benchmarks — and, in the general category, IFBench (79.5), GPQA Diamond (89.2), and HLE (30.8).
Not one of HoF-Bench, RULER, EvalPlus, HumanEval, MBPP, IFEval or BFCL appears, and the gap is generational rather than arbitrary. HumanEval and MBPP are retired at the publisher level, displaced by contamination-resistant live sets. IFEval became IFBench; BFCL moved to V4 and then off the card entirely. RULER is absent too — it remains a standard third-party yardstick, but Qwen makes no claims of that kind for this model. (This is also why IFEval and BFCL v3 were dropped from this project deliberately: they’d produce numbers nobody publishes anymore. LiveCodeBench v6 is the obvious next benchmark for this rig.)
Then there’s the attestation trap. Qwen’s published numbers are for the unquantized model at temperature 1.0 with thinking mode on. Every number in this post so far is temperature 0, non-thinking, Q4. A matching score would confirm nothing and a differing score would isolate nothing — the comparison confounds quantization with sampling with thinking mode. Attesting a published number requires reproducing the published conditions. So that’s what happened next.
GPQA Diamond and IFBench, under Qwen’s own conditions
These two ran under Qwen’s conditions rather than this rig’s: thinking mode on, temperature 1.0, top_p 0.95, top_k 20, min_p 0, still Q4. They are the only numbers in this post meant to sit next to a published figure.
The 16K cap that manufactured a wrong-answer rate
This is the part worth stealing, because it will happen to anyone benchmarking a thinking model, and it does not look like a bug.
The first attempt used a 16,384-token output budget and produced 72.0% on the first 50 questions. That number is fiction. Thirteen of the fifty ran out of budget mid-reasoning and never emitted an answer, and the scorer counted every one as wrong. Of the 37 that actually terminated, 36 were correct.
It’s invisible on disk. llama.cpp returns thinking in a separate reasoning_content field, so a length-truncated generation comes back with an empty content — which a runner that saves only content records as a confident wrong answer, with no trace of why.
72.0% → 89.4%. Same model, same questions, same sampling — the only change is the output token budget, 16,384 → 65,536. A truncated thinking-mode generation returns empty content and looks identical to a wrong answer unless you record finish_reason.
The obvious suspect was a degenerate repetition loop at temperature 1.0. That was wrong: measuring repeated 120-character shingles across a 102K-character reasoning chain gave a loop score of 0.00 — long, but not repetitive — and adding Qwen’s full recommended sampling changed nothing. Re-running three truncated questions with a 120,000-token ceiling settled it: they terminated at 40,093, 19,469 and 37,122 tokens — and all three answers were correct. One of them needed barely more than the old ceiling. The cap was the entire finding.
The cap adds bias, not noise
Reasoning length is not uniform across the benchmark, and that’s why this matters more than a mis-set parameter usually would:
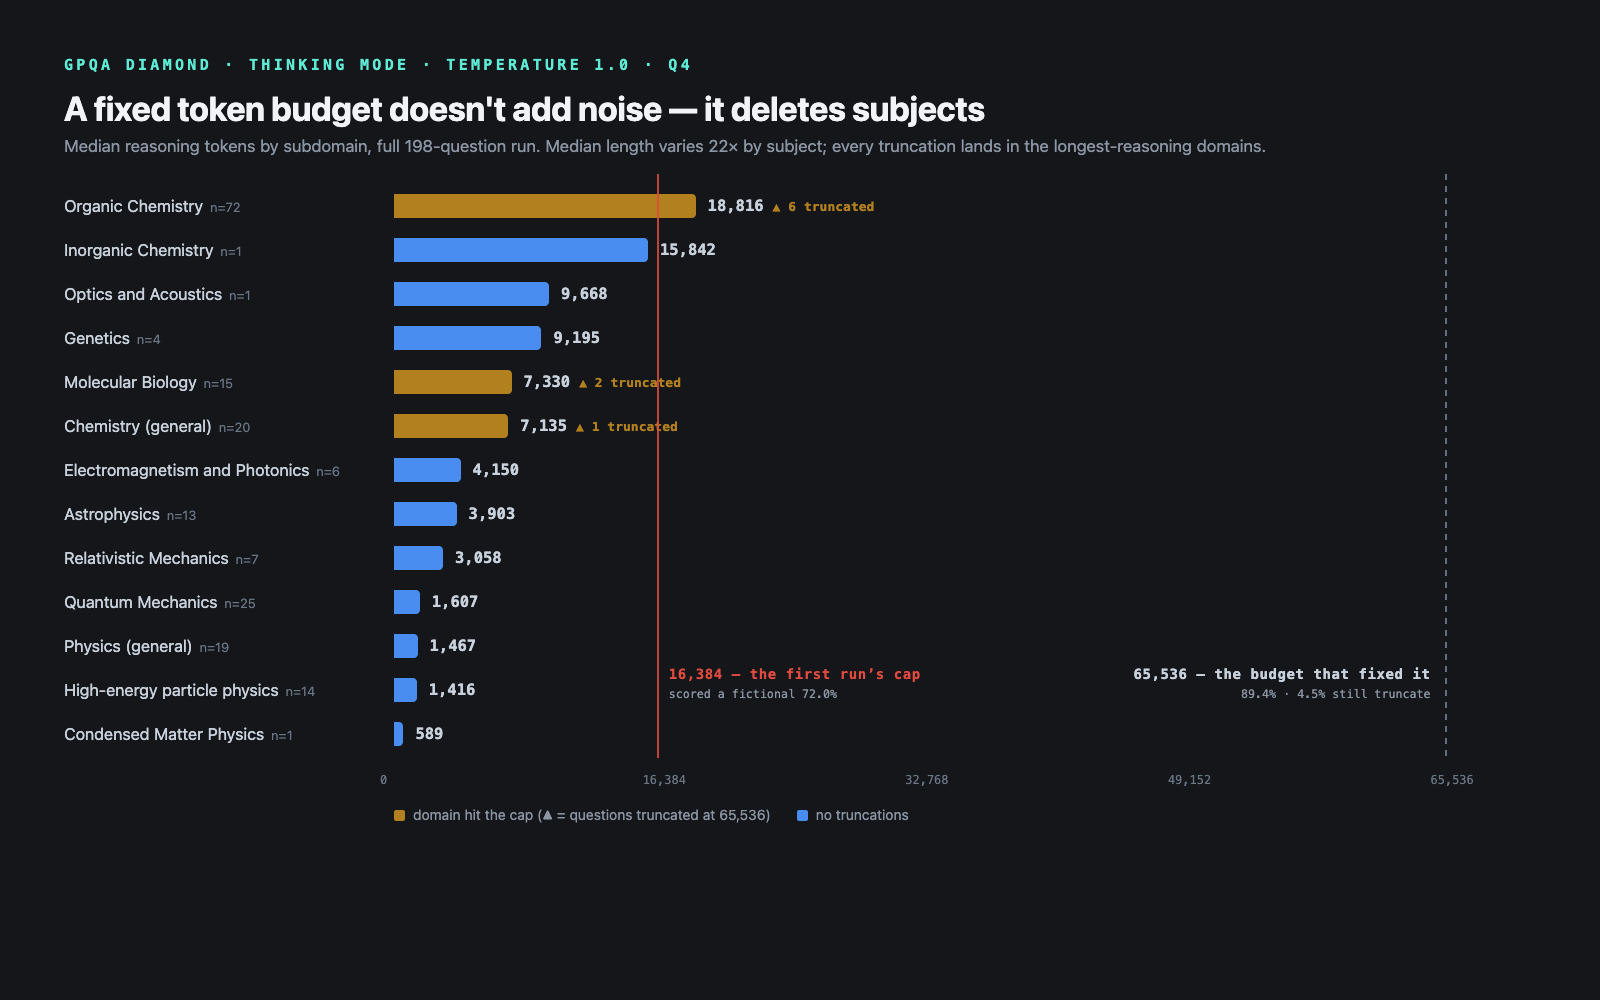
Median reasoning length varies 22× by subject — 904 tokens for general physics against 19,776 for organic chemistry on the truncation-probe sample — and every truncation observed falls in the longest-reasoning domains. A fixed output budget therefore doesn’t degrade the score uniformly; it removes one subject. A cap set anywhere in the middle of that range converts “organic chemistry” into “wrong” without a trace, and the resulting number isn’t a noisy estimate — it’s a biased one, systematic and pointing one direction. The truncation rate alone understates the damage: at 16,384 the rate was 26%, but the questions it destroyed were concentrated in a domain carrying roughly a third of the benchmark.
Three practices follow, and they generalize beyond this model:
- Record
finish_reasonand count truncations separately from wrong answers. They are different failures. Conflating them makes your token budget look like the model’s accuracy. - Never mine a truncated reasoning chain for an answer. Falling back to “last A–D token seen” would invent answers out of mid-deliberation text and score them as knowledge.
- Report both bounds — strict (truncations counted wrong) and terminated-only. The first is the honest headline, because failing to answer within a budget is a real deployment cost; the second tells you how much of the gap is budget rather than knowledge.
Instruction-following benchmarks have the same exposure and it bites harder: a truncated response is empty, and an empty response fails every constraint check while looking exactly like an instruction-following failure.
Results
Both benchmarks reproduce Qwen’s published BF16 figures within error, on a Q4 quant, on one 32 GB card.
Both gaps are smaller than their standard errors. The defensible word is indistinguishable — not “matched”, certainly not “beat”. The caveats at the end of this section are load-bearing.
GPQA Diamond in full:
| metric | value |
|---|---|
| strict (truncations counted wrong) | 177/198 = 89.4% |
| among the 189 that terminated | 176/189 = 93.1% |
| truncated at the 65,536 cap | 9 (4.5%) |
| request errors | 0 |
| median / mean / p90 completion tokens | 7,234 / 14,301 / 43,460 |
| wall-clock GPU time | 7.0 h |
Qwen’s 89.2 falls between the two bounds (89.4 strict, 93.1 terminated-only), so “does Q4 match the published number” has no clean yes/no — it depends on how you score a generation that ran out of budget. The defensible reading: Q4 cannot be told apart from the published unquantized figure, and the residual uncertainty is dominated by truncation policy rather than by quantization.
GPQA by subdomain — where the difficulty lives
| subdomain | n | accuracy | truncated | median tokens |
|---|---|---|---|---|
| Organic Chemistry | 72 | 86.1% | 6 | 18,816 |
| Quantum Mechanics | 25 | 100% | 0 | 1,607 |
| Chemistry (general) | 20 | 85.0% | 1 | 7,135 |
| Physics (general) | 19 | 89.5% | 0 | 1,467 |
| Molecular Biology | 15 | 80.0% | 2 | 7,330 |
| High-energy particle physics | 14 | 100% | 0 | 1,416 |
| Astrophysics | 13 | 100% | 0 | 3,903 |
| Relativistic Mechanics | 7 | 85.7% | 0 | 3,058 |
| Electromagnetism and Photonics | 6 | 100% | 0 | 4,150 |
| Genetics | 4 | 50.0% | 0 | 9,195 |
| Optics and Acoustics | 1 | 100% | 0 | 9,668 |
| Inorganic Chemistry | 1 | 100% | 0 | 15,842 |
| Condensed Matter Physics | 1 | 100% | 0 | 589 |
Two things fall out of this table, and both are more interesting than the headline score. The model is perfect on physics and mediocre on chemistry: quantum mechanics, particle physics, astrophysics and electromagnetism come to 58 questions without a single miss, and every error in the benchmark is concentrated in chemistry and biology. An aggregate “89.4% on GPQA” hides a model that is, on this evidence, saturated on one half of the benchmark. And difficulty tracks token cost: the domains it gets wrong are the domains where it reasons longest — organic chemistry burns a median 18,816 tokens against particle physics’ 1,416, a 13× spread. Long reasoning here is a symptom of struggle, not thoroughness.
Read the n column before quoting any row: several subdomains are n ≤ 7, where one question moves the percentage by 15+ points — Genetics at 50% is two of four. Only the top four rows carry enough weight to mean much individually.
IFBench in full
IFBench reports four numbers; here are all four, because Qwen’s card doesn’t say which convention its 79.5 uses, and the choice moves the comparison from 1.5 points below (strict prompt-level) to 3.2 above (loose prompt-level):
| metric | score |
|---|---|
| prompt-level, strict | 78.0% |
| instruction-level, strict | 80.2% |
| prompt-level, loose | 82.7% |
| instruction-level, loose | 84.3% |
Every difference is inside the ±2.4-point standard error, so the verdict is the same under any convention — but anyone quoting a single figure should say which one they used. This post’s headline is strict prompt-level because it’s the harshest of the four. Run shape: 300 prompts, 2 truncated at the 65,536 cap (0.7% — a non-issue here, unlike GPQA), 3 empty after reasoning-strip, median 3,914 completion tokens, 5.7 GPU-hours.
Caveats that are load-bearing
These are the only benchmarks in this post run at temperature 1.0 with thinking enabled, and that carries consequences the other sections don’t:
- Not reproducible. Temperature 1.0 means a rerun produces a different number. The stated standard errors quantify sampling of questions, not generations; run-to-run variance sits on top and is unquantified, because measuring it costs 7 hours per repeat.
- Single runs. Frontier-lab figures are often means over several runs; a single run is a noisier measurement than the number it’s being compared against.
- These cannot rank quantizations. They position Q4 against a published figure. Q4-vs-Q6-vs-NVFP4 is the KL and paired-test sections’ job; these two have neither the power nor the determinism.
- A Q4 quant scoring at or above an unquantized published number should invite suspicion, not celebration. The likeliest explanations are protocol differences — prompt template, answer extraction, sampling — rather than quantization improving a model. My extraction accepts
Answer: Xand falls back to the last standalone A–D token in the visible response; a stricter or looser extractor would shift the number.
A note on data handling: GPQA is a gated dataset whose terms require not revealing its questions online. Model responses were saved locally for grading, but no question text, answer option or verbatim excerpt appears in this post — the subdomain labels above are metadata, not content.
What a bigger quant buys you
Answer: Q6_K is measurably 5× closer to Q8_0 than Q4 is — and on this card it costs either a quarter of your context or all of your speculative decode, while winning zero additional tasks.
The design needs one sentence, because the obvious version of this experiment — run HoF-Bench on both, compare percentages — fails on arithmetic: at 95 tasks the standard error is ±5.1 points, and a quantization effect is expected to be a fraction of a point. So two sharper instruments instead: llama-perplexity --kl-divergence against Q8_0 logits over the HoF-Bench source files, which resolves differences orders of magnitude smaller than a task benchmark can, and McNemar’s exact test on the paired runs, which analyzes only the tasks where two runs disagree — and is the only test here that can include NVFP4, since KL-divergence cannot cross runtimes.
One naming caveat: UD-Q4_K_XL is 5.25 bpw, not the ~4.8 of a vanilla Q4_K_M — Unsloth’s Dynamic quants keep embeddings and output tensors at higher precision. “Q4” and “Q6” are families, not points. Q6_K weighs 21,824 MiB to the Q4’s 17,093.
Results
100 chunks × 512 tokens = 51,200 tokens of HoF-Bench source, Q8_0 as reference. Lower is better on every row except “same top-1 token”.
| metric (vs Q8_0) | Q6_K | UD-Q4_K_XL | Q4 / Q6 |
|---|---|---|---|
| Mean KLD | 0.001832 ± 0.000049 | 0.009076 ± 0.000229 | 5.0× |
| 99th percentile KLD | 0.0251 | 0.1528 | 6.1× |
| Max KLD | 0.603 | 1.126 | 1.9× |
| Same top-1 token | 98.89% ± 0.07 | 97.75% ± 0.09 | 2.3× the flips |
| RMS Δp | 1.43% ± 0.04 | 3.21% ± 0.07 | 2.2× |
| PPL(Q)/PPL(Q8_0) | 0.99976 ± 0.00045 | 1.00469 ± 0.00104 | — |
Q6’s perplexity ratio is statistically level with the reference — what near-lossless looks like. The tail is where Q4’s difference lives: 6.1× further from the reference at the 99th percentile, with 2.25% of top-1 tokens flipped against Q6’s 1.11%. This is the measured version of the widely-felt “Q4 gets close to Q8 but not quite.”
And here is what that real, cleanly measured difference converts into on an actual task:
| quant | HoF-Bench strict | paired vs Q4 | McNemar p |
|---|---|---|---|
| UD-Q4_K_XL | 49/95 = 51.6% | — | — |
| Q6_K | 48/95 = 50.5% | 3 fixed, 4 broke | 1.0000 |
| NVFP4 | 48/95 = 50.5% | 2 fixed, 3 broke | 1.0000 |
NVFP4 against Q6 head-to-head: 3 fixed, 3 broke, p = 1.0000 — an exact tie. Three quantizations spanning 17.1 to 21.8 GB are statistically tied on this benchmark, and that pairing — a sensitive instrument detects a real difference, the task benchmark shows it doesn’t convert into wins — is the intellectual core of this post. For scale: toggling MTP, which in theory changes nothing, flipped 7 of 95 verdict texts.
What it costs on a 32 GB card
Measured by loading each configuration, not estimated. Max total context, both quants with MTP:
| slots | UD-Q4_K_XL | Q6_K |
|---|---|---|
| 1 | 262,144 | 196,608 |
| 2 | 262,144 | 196,608 |
| 4 | 262,144 | 180,224 |
| 8 | 196,608 | 98,304 |
Q6_K + MTP at 262,144 dies in cudaMalloc; it fits the full window only with MTP disabled. The 8-slot collapse is architectural: Gated Delta Net state is per-sequence, and eight copies of it on top of Q6’s extra 4.7 GB of weights is what runs out. The trade, in one line: Q6 with MTP caps near 196K and collapses under concurrency; Q4 holds 262K at up to four slots and 196K at eight — at 5× a measured divergence that no task above could detect.
NVFP4: reads like 4-bit, prices like 6-bit
NVFP4 ran on a second runtime — vLLM 0.23.0, since llama.cpp cannot produce an NVFP4 GGUF. The short version: same measured quality, a genuinely inverted speed shape, and a name that undersells its size.
It is not a 4-bit model. Per its own quantization_config, only the primary MLP layers are NVFP4; attention, the last eight MLP layers, and all 48 Gated Delta Net layers are FP8 or unquantized BF16. The file lands at 21,553 MiB — 1.3% away from Q6_K, a 26% premium over the Q4. Check the file size and quantization_config before choosing a quant by its name.
Quality: the three-way tie above. Same protocol, same prompts, 48/95 — statistically level with both llama.cpp quants (and since a different runtime means a different tokenizer path and sampler, nothing rests on a sub-point difference anyway).
Speed: a real split, in opposite directions.
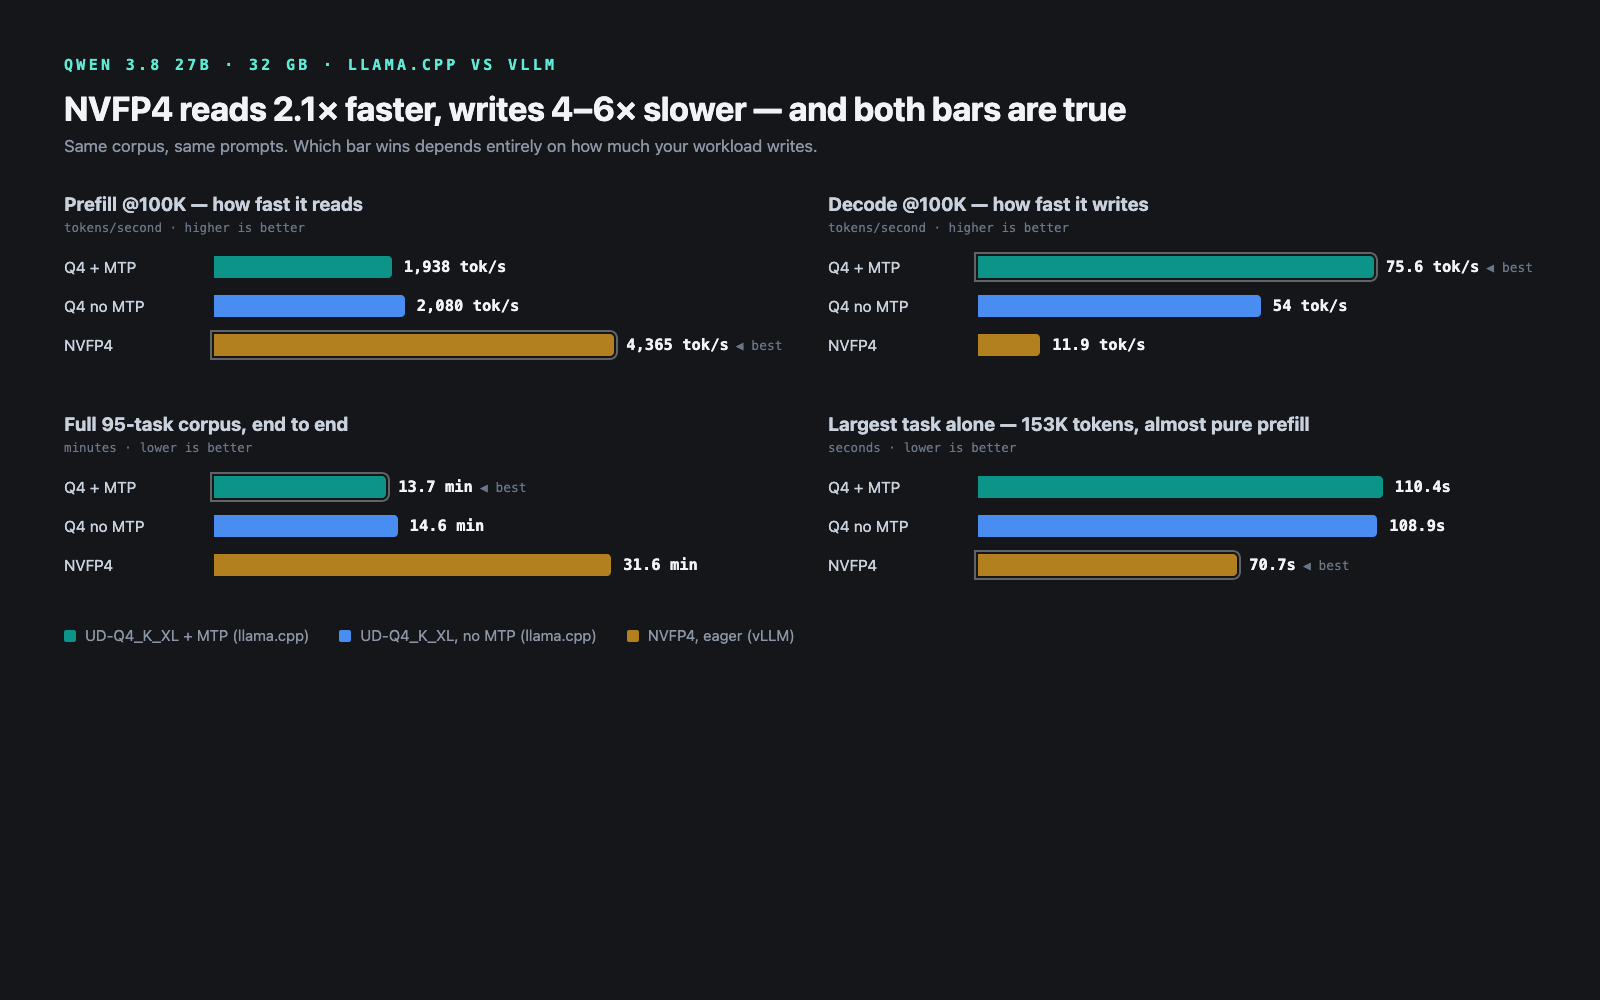
| decode @100K | prefill @100K | HoF total | HoF worst task | |
|---|---|---|---|---|
| Q4 + MTP (llama.cpp) | 75.6 tok/s | 1,938 tok/s | 13.7 min | 110.4s |
| Q4 no MTP (llama.cpp) | 54.0 tok/s | 2,080 tok/s | 14.6 min | 108.9s |
| Q6 no MTP (llama.cpp) | — | — | 17.2 min | 108.6s |
| NVFP4 eager (vLLM) | 11.9 tok/s | 4,365 tok/s | 31.6 min | 70.7s |
(Q6’s per-request rates were never separately benched — its two measured columns are the corpus totals. NVFP4’s comparisons below are against Q4’s no-MTP arm, the like-for-like no-drafter configuration.)
NVFP4 prefills 2.1× faster — Blackwell’s FP4 tensor cores doing genuine work — and decodes 4.5× slower than Q4’s plain decode, 6× slower once Q4 turns MTP on. End-to-end it’s 2.2× slower on the full corpus, yet 35% faster on the single largest task, because a 153K-token bundle is almost pure prefill. The crossover is real: bulk scanning favours NVFP4, anything with meaningful generation favours Q4. And the decode number isn’t tunable: with CUDA graphs enabled, vLLM cannot fit any KV cache next to 21.5 GB of weights on this card, so --enforce-eager — and its 11.9 tok/s — is the only mode that exists. It does clear the one bar Q6 fails: the full 262,144-token window at one slot.
The verdict, assembled
Four instruments, none individually decisive, pointing the same way:
- KL-divergence (the microscope): Q6 is 5.0× closer to Q8 on the mean, 6.1× at the 99th percentile. The difference between quants is real and measurable.
- HoF-Bench, paired (the task test): Q4 49, Q6 48, NVFP4 48, every McNemar p = 1.0. The measurable difference converts into nothing on a real task.
- RULER (the window test): 100% on every synthetic task at every length to 262,144 — at Q4. The architecture’s headline feature survives the cheapest quant.
- GPQA + IFBench under published conditions (the attestation): 89.4 vs 89.2 and 78.0 vs 79.5, both inside the error bars. The Q4 quant is indistinguishable from the figures Qwen published for the unquantized model.
Add the deployment table — Q4 is the only quantization that holds ~200K context at every slot count on this card — and the recommendation writes itself. Run the UD-Q4_K_XL, with MTP on for interactive work and off for bulk scanning. Not because quality differences don’t exist (they measurably do), but because nothing at the task level can find them, and the VRAM they cost buys context and concurrency that are very findable indeed.
What I’d trust and what I wouldn’t
What I’d trust: every number was measured on this rig and audited against the raw result files while writing this post; GPQA, IFBench, KL, EvalPlus, RULER and the throughput sweeps all reproduce from saved artifacts; temperature-0 sections are deterministic modulo the speculative-decode caveat documented above.
What I wouldn’t generalize without care:
- Everything here is a statement about this quantization on this rig, not about Qwen 3.8’s weights in general. The BF16 model never ran here — it can’t.
- Two protocols live in this post. Everything except GPQA/IFBench: temperature 0, non-thinking, deterministic — the deployed configuration. GPQA/IFBench: temperature 1.0, thinking on — Qwen’s published conditions. Numbers from the two groups must never share a table.
- The GPQA and IFBench runs are single runs at temperature 1.0 — not reproducible, question-sampling error only, generation variance unquantified.
- Truncation policy moves the GPQA headline between 89.4 and 93.1; the published 89.2 sits between the bounds. This post leads with the strict number because failing to answer within a budget is a real deployment cost.
- Organic chemistry is 36% of GPQA Diamond and is both the lowest-accuracy and most token-hungry subdomain; any change to the token budget moves that block first, and the aggregate with it.
- The HoF-Bench grader is my lightweight local proxy, not the official blinded judge, and Muse Glimmer’s 50.0% carries its own asterisks from the previous post — cross-post comparisons inherit both.
- Resist ranking anything by differences under ~5 points. Every accuracy number here is one run at n ≈ 95–378. The paired tests exist precisely because the headline percentages can’t carry that weight.
The one-line version: the model the community waited for turns out to be a 27B that keeps a KV cache on only a quarter of its layers, holds every token of its 262K window, matches its publisher’s benchmark numbers on a 17 GB quant — and taught me, via a fake 72%, that when you benchmark a thinking model, the first thing you’re measuring is your own token budget.